We have previously added Bollinger bands
to the chart to complement the Moving Average and the next one to
include is the relative strength index (RSI) to complement the Bollinger
Bands.
The RSI can be used to chart the strength or weakness of a trading
period and can be classified as a momentum oscillator, measuring the
velocity and magnitude of directional price movements.
The range is between 1 and 100. Readings of greater than e.g. 80 and
lower than e.g. 20 (70,30 is also popular) can be considered overbought
and oversold respectively.
On the daily graph below I am still using the short (green) SMA of 5
and the longer (red) SMA of 20 with a Bollinger Band SMA of 20 with
deviation (upper and lower bands set at 2). The RSI has 80,20
overbought / sold areas.
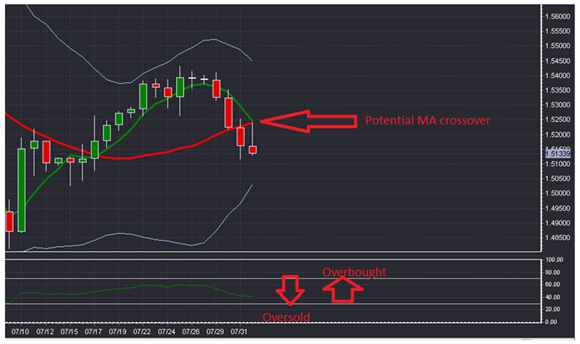
Based on the chart I will start to look to position myself to short the
market when the short SMA crosses the longer SMA. Some traders may try
to pre-empt the crosser and may start to short the market it the SMAs
touch. Either way, I can use the SMI to give strength to my belief that
the market is still trending downwards, but will keep an eye out for
when it hits the 20 mark.
Happy trading!
The Hirose Team
 My Hirose Login